Abstract
Risk and performance statistics decide how funds are ranked, how capital is allocated and how strategies are marketed. Almost all of them are computed from reported returns, which means they inherit whatever the reporting process does to those returns. This paper investigates how far each of ten widely used statistics can be pushed by someone who wants to look good on that statistic but is constrained to deliver no genuine economic improvement. We define a single comparable measure, the manipulation ratio, and evaluate ten metrics against five attacks: return smoothing, tail-risk selling, path reordering, reporting-period selection and option-based payoff reshaping. Two results follow analytically and require no data at all. An exponential smoother with parameter θ scales reported volatility by √((1 − θ)/(1 + θ)), which inflates the Sharpe ratio by a factor of 1.53 at θ = 0.4 while leaving the underlying holdings completely untouched. As terminal wealth is invariant to the order in which returns arrive, a fixed set of returns ending at an identical final value can report a maximum drawdown anywhere between 3.20% and 17.38% in our worked example — a factor of 5.43 from reordering alone. We found the worst-case manipulation ratio across all five attacks was 10.00 for volatility and 1.00 for skewness.
Research Question
Fund performance is often reduced to a handful of familiar metrics. Factsheets highlight measures such as the Sharpe ratio, maximum drawdown, Sortino ratio and Calmar ratio, which are then used in screening tools, allocator shortlists and platform rankings. However, these metrics are rarely accompanied by any indication of how robust they are to manipulation, or how easily they can be improved without meaningfully improving the underlying investment strategy. That is the question this report takes up. Rather than asking what each statistic measures, we ask what happens when someone attacks it:
If a manager wanted to score well on a given risk metric without generating any real economic edge, how far could they push it — and which metrics resist this the most?
Most financial metrics are evaluated by how well they describe typical market behaviour. Here the question is different: how do those same metrics behave when someone is actively trying to exploit their weaknesses? This way of thinking is more common in fields such as cybersecurity, where a system is tested against deliberate attempts to break it rather than ordinary use. Applying that perspective to investment performance metrics is the central idea of this work.
The manipulability of performance statistics is not itself a new result. Lo (2002) showed the statistical fragility of the Sharpe ratio; Getmansky, Lo and Makarov (2004) demonstrated how illiquid assets can produce artificially smooth reported returns; and Goetzmann, Ingersoll, Spiegel and Welch (2007) showed that the Sharpe ratio can be manipulated. Each of these studies focuses on a particular statistic or mechanism. What is still missing is a framework that tests multiple performance metrics against multiple forms of manipulation on one comparable scale, with the underlying machinery available for others to reproduce and extend.
The Metric Panel
Ten statistics were selected to cover the main metric families an allocator would typically encounter, alongside one control. Priority was given to statistics that commonly appear on fund factsheets and screening platforms, rather than measures that may be theoretically preferable but are rarely reported. The set includes two dispersion measures, two tail-risk measures and two path-dependent measures, so results can be compared across metric families rather than treated in isolation. Three ratio measures are included because they are widely used to rank and screen funds, and skewness is included because it is commonly used to describe the asymmetry of a return distribution — which makes it a natural target for manipulation.
Throughout, rt denotes the periodic return, k the number of periods per year, μ and σ the periodic mean and standard deviation, and Wt the cumulative wealth index.
| Metric | Family | Definition |
|---|---|---|
| Volatility σa | Dispersion | |
| Downside deviation σd | Dispersion | |
| Value at Risk VaR95 | Tail | , the empirical 5th percentile |
| Expected shortfall ES95 | Tail | |
| Maximum drawdown Dmax | Path | |
| Ulcer index U | Path | , dt the drawdown at t |
| Skewness γ1 | Shape | |
| Sharpe ratio S | Ratio | |
| Sortino ratio So | Ratio | |
| Calmar ratio C | Ratio | |
| MPPM Θ (control) | Utility | see the equation below |
The control is the manipulation-proof performance measure (MPPM) developed by Goetzmann et al. (2007). It is designed so that it cannot be improved through trading strategies that do not also increase the investor's expected utility:
ρ is the coefficient of relative risk aversion (ρ = 3 throughout) and Δt is the length of one period in years.
If the framework is working correctly, every attack should move the ten metrics and leave Θ essentially untouched. This provides a built-in validity check, allowing the results to be assessed against a measure specifically designed to resist manipulation.
The Manipulation Ratio
Two things need handling before attacks can be compared across metrics. The first is direction. For some metrics a higher value looks better (Sharpe, Sortino, Calmar); for others a lower value looks better (volatility, VaR, drawdown). We attach a direction indicator dM = +1 when higher is better and dM = −1 when lower is better, so that a ratio above one always means the attack made the fund look better.
The more important issue is that a metric can be improved trivially if the underlying return distribution is also allowed to improve. To isolate manipulation from genuine investment skill, any attack must leave the investor no better off. We impose this constraint using the MPPM, requiring that an attack does not increase the investor's expected utility. For a metric M, an honest return stream r and an attack A:
A ratio of 1.00 means the metric was completely unmoved; 2.00 means the attacker doubled the apparent quality of a fund that is, by construction, no better than it was.
Because a real adversary chooses whichever attack works best, we report the worst case across all attacks as the headline robustness score for each metric, rather than an average:
The largest manipulation ratio any of the five attacks achieves against metric M.
The Attack Library
Five attacks were implemented, in two categories. Reporting and measurement attacks change the return series the evaluator sees, without improving the underlying investment outcome. Payoff and strategy attacks change the return-generating process itself, but are still constrained so that investor welfare has not improved. Together they test whether a metric can be distorted through its presentation, and whether it can be improved through economically unproductive trading.
Reporting and measurement attacks
Attack 1 — Return smoothing. Reported returns are passed through an exponential smoother:
Each reported return blends this period's true return with last period's reported return.
This is the mechanism Getmansky, Lo and Makarov identified in hedge fund returns, where illiquid or stale-marked positions produce the same effect without anybody intending it. The overall mean is unchanged, but for independent returns the reported variance shrinks:
Volatility falls while the mean stays the same, so every volatility-based ratio is inflated.
Because the mean stays unchanged, the reported Sharpe ratio is inflated: by 1.53× at θ = 0.4 and 1.73× at θ = 0.5. The portfolio itself is not changed in any way — only the reporting is. This is particularly relevant to hedge funds and other vehicles that hold illiquid assets: because those holdings are not always marked to fresh market prices, their reported returns can look much smoother than their economic returns.
Attack 2 — Path reordering. This attack keeps the same set of returns but changes the order in which they arrive. Terminal wealth, WT = ∏t(1 + rt), depends only on the product of the returns, so reordering cannot change the final wealth. Path-dependent statistics such as maximum drawdown, the Ulcer index and the Calmar ratio, however, depend entirely on that order. This attack tests how strongly each metric is influenced by the sequence of returns alone (see Figure 1).
Attack 3 — Reporting-period selection. The simplest attack conceptually. The full return series is unchanged, but the manager cherry-picks the window of returns that makes the target metric look best. This tests how sensitive a metric is to the choice of start and end date, rather than to any genuine improvement in the underlying investment.
Payoff and strategy attacks
Attack 4 — Tail-risk selling. Consider a strategy that earns a small positive return p most of the time, but occasionally suffers a large loss L:
Setting p = qL makes the expected return exactly zero: the strategy has no positive edge.
If the loss is rare, it is unlikely to appear in a reported track record at all, and the metrics look strong. With q = 0.01 per month, the probability that a five-year record contains no loss event is 0.9960 = 54.7%. More than half of all such records will look strong, despite the strategy having no economic value.
Attack 5 — Payoff reshaping. An option overlay is used to alter the shape of the return distribution — for example, turning a series with several small negative returns into one with a single negative return and everything else positive. This tests whether a metric can be made to look stronger purely by redistributing where gains and losses occur.
Results
Figure 1 shows the path-reordering attack on a fixed, illustrative set of 24 monthly returns (not real market data). Both paths start and finish at the same wealth index of 107.66, so the investor's economic outcome is identical — yet the reported maximum drawdown differs by a factor of 5.43.
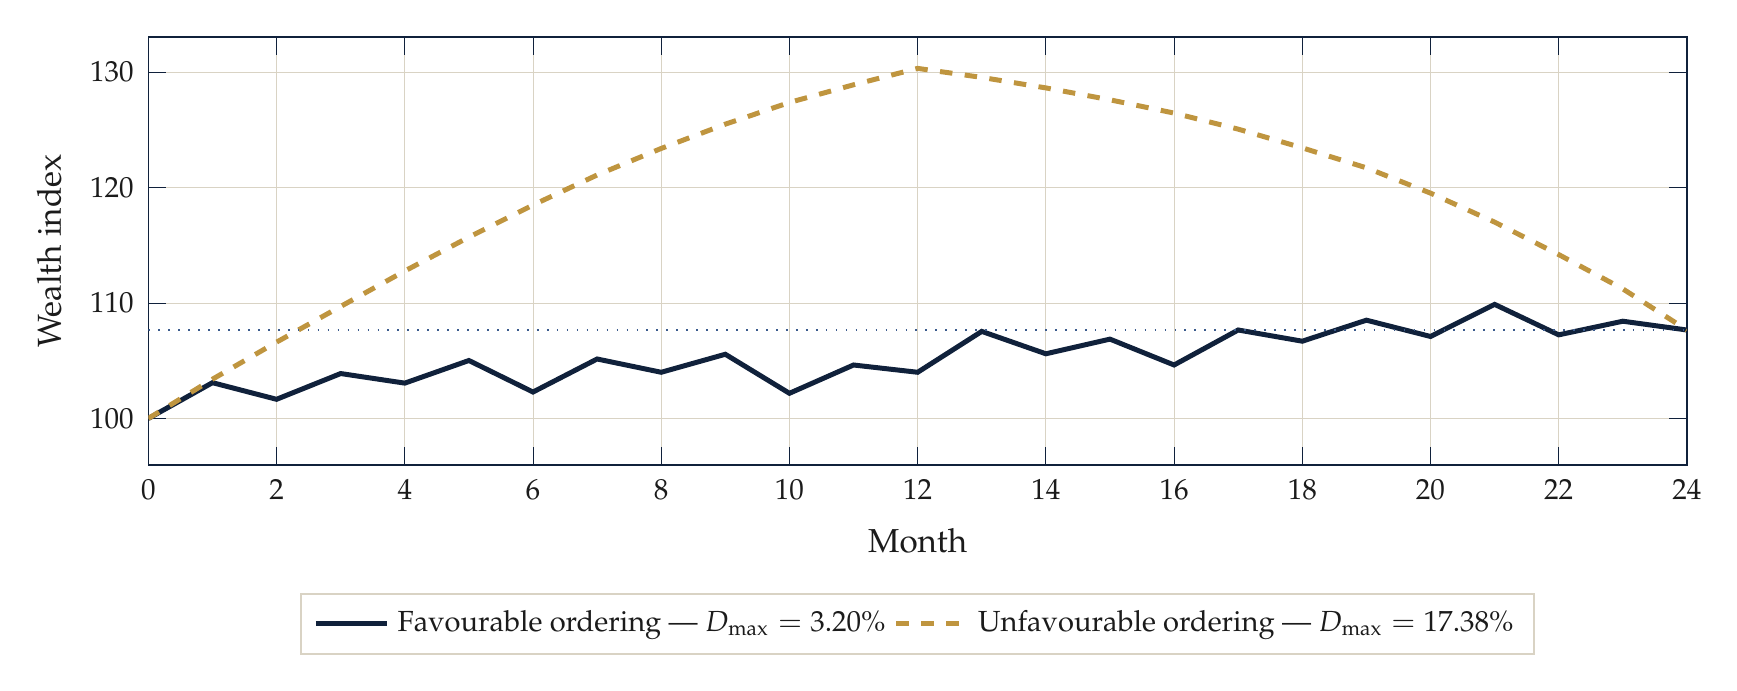
Figure 1 — The same 24 monthly returns in two orders. Both end at a wealth index of 107.66; maximum drawdown is 3.20% vs. 17.38%.
Figure 2 gives the full result: the manipulation ratio for every attack against every metric.
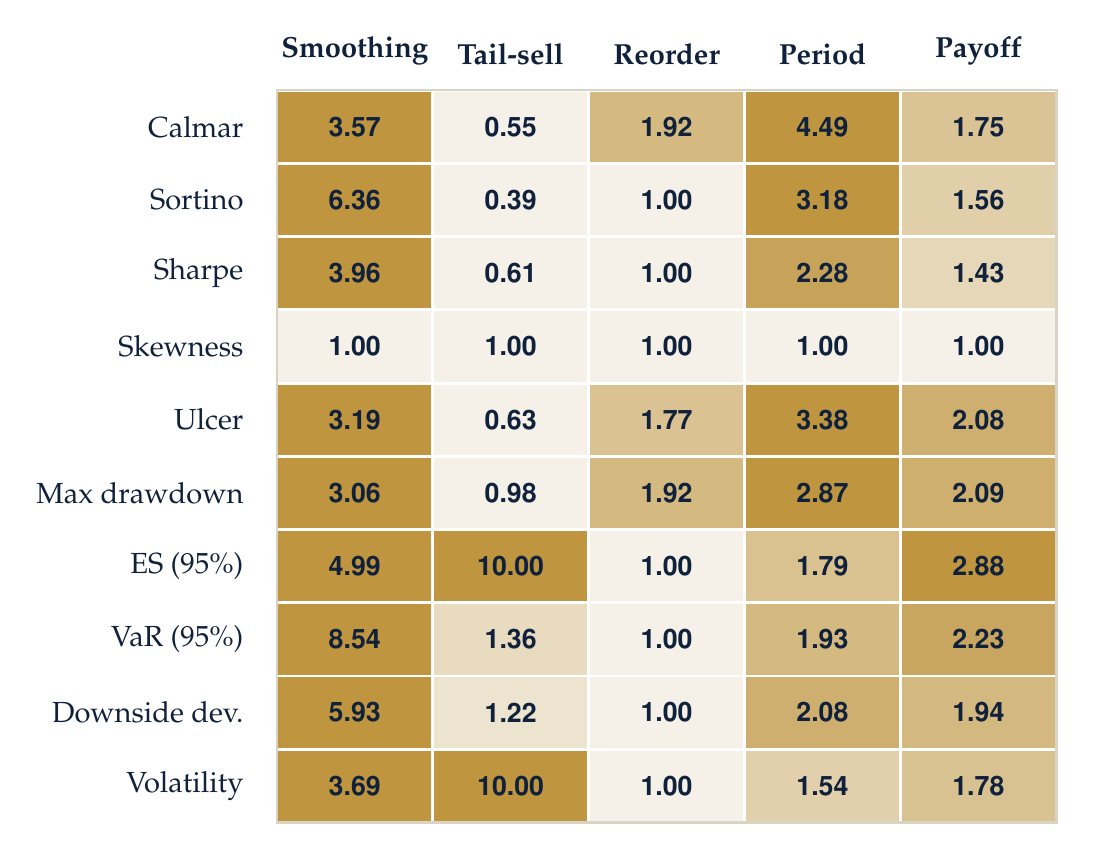
Figure 2 — Manipulation ratio for each attack on each metric. A value of 1.00 means the metric was unmoved.
Different attacks have substantially different effects on different metrics. Return smoothing had the broadest effect, producing large values for almost every metric. Tail-risk selling was much more concentrated: most of its effect fell on expected shortfall and volatility, and values below 1.00 elsewhere show that it actually makes some metrics look less favourable. Path reordering mainly affected the path-dependent metrics, leaving the distribution-based metrics unchanged. Reporting-period selection and payoff reshaping affected a wider range of metrics, but by smaller amounts than smoothing. Skewness remained unchanged under every attack.
| Metric | MR* | Worst attack | Interpretation |
|---|---|---|---|
| Volatility | 10.00 | Tail-sell | Highly vulnerable to hidden tail risk |
| ES (95%) | 10.00 | Tail-sell | Extremely distorted by tail losses |
| VaR (95%) | 8.54 | Smoothing | Sensitive to return smoothing |
| Sortino | 6.36 | Smoothing | Strongly inflated by smoothing downside variation |
| Downside dev. | 5.93 | Smoothing | Highly sensitive to smoothing |
| Calmar | 4.49 | Period | Strongly dependent on reporting window |
| Sharpe | 3.96 | Smoothing | Inflated by smoothing volatility |
| Ulcer | 3.38 | Period | Dependent on reporting window |
| Max drawdown | 3.06 | Smoothing | Sensitive to return smoothing |
| Skewness | 1.00 | None | Robust against all attacks |
| MPPM Θ (control) | — | — | Should remain near 1.00 |
For the payoff and strategy attacks, the MPPM control ensures that any improvement in the target metric is not accompanied by an improvement in investor welfare.
One clear expectation was contradicted. We expected tail-risk selling to inflate Sharpe and Sortino, since a sample of small gains with no tail event should look very stable, with low volatility. Instead the attack reduced both measures, with manipulation ratios of 0.61 and 0.39 respectively. This suggests that the benefit of hiding tail risk is more metric-specific than it first appears.
Application to Real Fund Returns
It is worth testing whether these ideas actually show up in practice, and return smoothing gives a way to do that. For the exponential smoother of Attack 1, the first-order autocorrelation of reported returns is exactly the smoothing parameter:
So θ can be estimated straight from a published return series as = .
Inverting the volatility-shrinkage result then recovers an implied, "de-smoothed" Sharpe ratio:
The Sharpe ratio the fund would report if its smoothing were removed.
We applied this to a set of exchange-traded funds, split by how liquid their underlying holdings are:
| Fund | Exposure | Reported S | Implied S | Cut | |
|---|---|---|---|---|---|
| Highly liquid underlying holdings | |||||
| SPY | US large-cap equity | 0.99 | 0.00 | 0.99 | 0% |
| QQQ | US technology equity | 1.08 | 0.00 | 1.08 | 0% |
| IEF | US Treasuries, 7–10 year | 0.17 | 0.03 | 0.17 | 3% |
| Less liquid underlying holdings | |||||
| IWM | US small-cap equity | 0.54 | 0.00 | 0.54 | 0% |
| HYG | US high-yield credit | 0.61 | 0.00 | 0.61 | 0% |
| VNQ | US real estate | 0.38 | 0.00 | 0.38 | 0% |
| EMB | EM sovereign debt | 0.34 | 0.00 | 0.34 | 0% |
This is a null result. No fund in the sample shows smoothing, and de-smoothing changes Sharpe ratios by no more than 3%. This suggests that the smoothing effect depends more on how assets are priced and reported than on how illiquid they are: because ETFs trade continuously, stale valuations are limited. The smoothing effect identified by Getmansky, Lo and Makarov is therefore more relevant to self-reported or infrequently valued vehicles such as hedge funds and private funds.
Key Findings
- Return smoothing was the most broadly effective attack. It pushed the manipulation ratio above 3 for every metric except skewness — 8.54 for VaR, 6.36 for Sortino and 3.96 for Sharpe — without changing the underlying portfolio at all.
- Tail-risk selling produced the largest single distortions, but only on some metrics. Volatility and expected shortfall both reached 10.00, the highest values in the study. Contrary to our expectation, the same attack reduced Sharpe (0.61) and Sortino (0.39).
- Path-dependent metrics can be moved by presentation alone. Reordering the same returns moved maximum drawdown and Calmar by 1.92× while leaving every distribution-based metric at 1.00; choosing the reporting window pushed Calmar to 4.49× and the Ulcer index to 3.38×.
- Skewness was the only metric unmoved by every attack. Its manipulation ratio was 1.00 across all five attacks.
- Real ETFs showed no hidden smoothing. Estimated smoothing was zero or near zero for all seven funds tested, including those with less liquid holdings — smoothing appears to depend on the pricing and reporting process rather than on the liquidity of the underlying assets.
Limitations
- These attacks are not observed in real fund data. This paper tests how the figures could be manipulated; it does not claim that any fund has actually used these attacks. If they were used, it would most likely be by vehicles holding illiquid assets.
- The economic constraint depends on the assumed coefficient of relative risk aversion. All results use ρ = 3, and the manipulation-proof measure is only manipulation-proof relative to the preferences it represents — an investor with different risk preferences could draw a different line between manipulation and genuine improvement.
Conclusion
Across the five attacks, the worst-case manipulation ratios were highest for volatility and expected shortfall, followed by VaR, Sortino, downside deviation, Calmar, Sharpe, the Ulcer index and maximum drawdown, while skewness remained unchanged in our tests. Return smoothing was the most broadly effective attack, materially improving almost every metric, although tail-risk selling produced the largest individual distortions.
The main implication for an allocator is that no performance statistic should be interpreted in isolation. A strong Sharpe ratio, low volatility or limited drawdown can reflect the structure or reporting of returns rather than genuine economic improvement, so metrics should be considered alongside the full return history, payoff structure and valuation process.
Read the complete methodology, figures and analysis in the full paper.
Download Full Research Paper